After you’ve tried preliminary browser troubleshooting steps, this support page will help you provide us with more information to troubleshoot why your WordPress.com site may not be loading in your browser.
In this guide
If it seems like you’re having difficulty connecting to our servers here at WordPress.com, we might ask you to run a “traceroute” which gives us detailed information about how you’re connecting to us.
To get a traceroute, follow the instructions below. You can paste the output of this command into a text file (Notepad for Windows or TextEdit for OS X), then attach the .txt file to your email when you reply to us or copy-paste it.
✅
In the following commands replace
mydomain.wordpress.comwith any public WordPress.com URL that you are having trouble loading. Do NOT copy a full link with http:// at the beginning, but rather type out the URL without that.
- Windows 10, 7 , and Vista: From the Start Menu, in the search field, type “cmd,” then press the Enter key to open a command prompt window.
Previous versions of Windows: From the Start menu, click Start → Run, type “cmd,” then press the Enter key. - Type the following command into the Command Prompt window, and press Enter:
tracert mydomain.wordpress.com
- Allow the command to finish running even if it seems like it’s going to hang. Highlight the result of the command and press the Control + C keys to copy. Then, select all of the text in the command prompt window and press the Enter key.
- Paste (Control + V) it into your reply.
- Go to your Applications → Utilities folder.
- Open the Terminal.
- In the Terminal, type the following command, and press the return key:
traceroute -I mydomain.wordpress.com
- Allow the command to finish running even if it seems like it’s going to hang. Highlight the result of the command and press the Command + A keys to select all the text, then press the Command + C keys to copy it to your clipboard.
- Paste (Command + V) the output into your reply.
- Open the terminal emulator of your choice.
- Type the following command and press ENTER:
traceroute -I mydomain.wordpress.com
- Allow the command to finish running even if it seems like it’s going to hang. Then, copy all the output.
- Paste the output into your reply.
If it seems like certain resources on your WordPress.com or dashboard are loading slowly or not at all, we might ask you to send us the HTTP headers output from your browser.
To send this to us, follow the below instructions depending on your browser:
- Go to Tools → Browser Tools →Web Developer Tools in the Firefox menu. Then click on the Network tab on the bottom panel.
- You can also open Developer Tools from Application Menu (the three horizontal lines at the top right) → More Tools → Web Developer Tools.
- In your browser address bar, go to your WordPress.com site. That will log HTTP calls in the Network tab.
- Click the Separate Window option at the upper–right corner of the Network tab, then maximize that window:

- Take a screenshot image for each “page” by scrolling down until you’ve captured all the results in screenshots (it will likely take more than one).
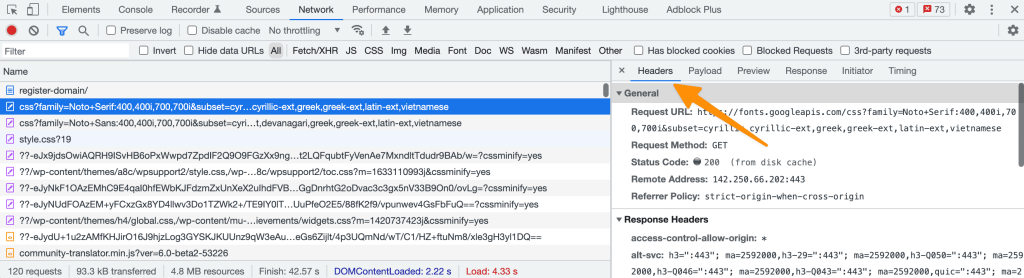
- (Optional) If there are any resources that take more than a few seconds to load, you can click on that line to display the Request and Response Headers:

- In Google Chrome, go to View → Developer → Developer Tools (Ctrl-Shift-I for Windows), then click the Network tab at the top of the console that opens.
- You can also open Developer Tools from Settings (the three vertical dots at the top right) → More Tools → Developer Tools. Then click on the Network tab.
- In your browser address bar, go to your WordPress.com site. That will log HTTP calls in the Network tab. Click the Undock into separate window button, located at the upper–right corner of Developer Tools, then maximize that window:

- Click on the Time column at the top to sort by time (descending, denoted with a downward pointing arrow in the header row). Scroll to the top of the list to display the slowest loading content.
- Take a screenshot image for each “page” by scrolling down until you’ve captured all the results in screenshots (it will likely take more than one).
- (Optional) If there are any resources that take more than a few seconds to load, you can click on that line to display the Request and Response Headers:
- In Safari, open Preferences, then click the Advanced tab, and check “Show Develop menu in menu bar”.

- In the Safari menu, go to Develop → Show Web Inspector.
- In the panel that opens at the bottom, click on the Timelines tab, and then on the Network Requests panel on the left.
- In the address bar, go to your WordPress.com site. That will log HTTP calls in the Details section at the bottom of the Network Requests tab:

- Take a screenshot image for each “page” by scrolling down until you’ve captured all the results in screenshots (it will likely take more than one).
- You can also see the Request and Response Headers by clicking on the Network tab, and then on a specific request on the left:

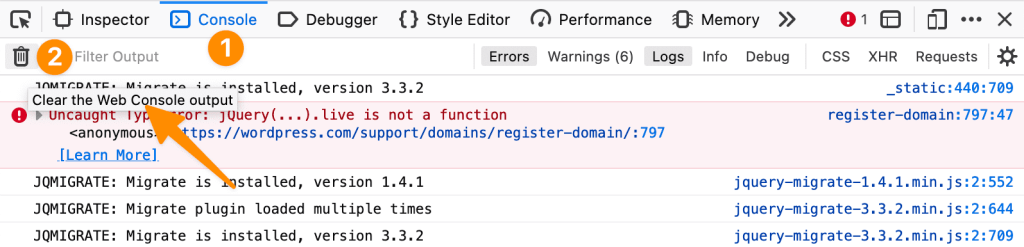
If you’re having trouble with one of the interactive elements in your Dashboard, such as the Add Media button, we might ask you to check your console for JavaScript errors.
To do this, go to the screen where you are having the problem, and then follow the steps for your browser below:
- Go to Tools → Browser Tools → Web Developer Tools in the Firefox menu.
- You can also open Browser Console from Application Menu (the three horizontal lines at the top right) → More Tools → Browser Console.
- Click on the Console tab.
- In the console toolbar, click the Clear the Web Console output button, and reload the page.
- Take a screenshot of all the errors that are shown. You can choose the Separate Window option to display all the errors on a larger window before capturing the screenshot.

- In Google Chrome, go to View → Developer → JavaScript Console (Press Ctrl-Shift-I for Windows).
- You can also open Developer Tools from Settings (the three vertical dots at the top right) → More Tools → Developer Tools, and then click on the Console tab.
- The error console will open at the bottom of the page. If you don’t see any errors, make sure that the Console tab at the top of the console and reload your site to log any JavaScript errors.

- Take a screenshot of all the errors that are shown. You might need to drag the top of the console higher so that all the errors are displayed on the screen.
- In Safari, open Preferences, then click the Advanced tab, and check “Show Develop menu in menu bar”.
- In your Safari menu, go to Develop → Show JavaScript Console, and the Error Console will open at the bottom of your screen:

- Take a screenshot of all the errors that are shown. You might need to drag the top of the console higher so that all the errors are displayed on the screen.